Pie Chart
Contents
Parent page: Schematic Objects

A placed Pie Chart
Summary
A pie chart is a non-electrical drawing primitive. It is a circular sector graphic element that can be placed on a schematic sheet and can be filled or unfilled.
Availability
Pie charts are available for placement in both Schematic and Schematic Library Editors:
- Schematic Editor - click Home | Graphical Elements |
 from the main menus.
 - Schematic Library Editor - click Home | Place | from the main menus.
Placement
After launching the command, the cursor will change to a cross-hair and you will enter pie chart placement mode. Placement is made by performing the following sequence of actions:
- Click or press Enter to anchor the center point of the pie chart.
- Move the cursor to adjust the radius of the pie chart, then click or press Enter to set it.
- Move the cursor to adjust the start point of the segment, then click or press Enter to anchor it.
- Move the cursor to change the position of the segment's end point, then click or press Enter to anchor it and complete placement of the pie chart.
- Continue placing further pie charts, or right-click or press Esc to exit placement mode.
Additional actions that can be performed during placement – while the pie chart is still floating on the cursor, and before the center point of the is anchored – are:
- Press the Tab key to access an associated properties dialog, from where properties for the pie chart can be changed on-the-fly.
- Press the Alt key to constrain the direction of movement to the horizontal or vertical axis, depending on the initial direction of movement.
- Press the Spacebar to rotate the pie chart counterclockwise or Shift+Spacebar for clockwise rotation. Rotation is in increments of 90°.
- Press the X or Y keys to mirror the pie chart along the X-axis or Y-axis respectively.
Graphical Editing
This method of editing allows you to select a placed pie chart object directly in the workspace and change its size, shape or location graphically.
When a pie chart object is selected, the following editing handles are available:
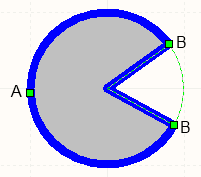
A selected Pie Chart.Click and drag A to adjust the radius.
- Click and drag B to adjust the end points.
- Click anywhere on the pie chart – away from editing handles – and drag to reposition it. While dragging, the pie chart can be rotated (Spacebar/Shift+Spacebar) or mirrored (X or Y keys to mirror along the X-axis or Y-axis respectively).
Non-Graphical Editing
The following methods of non-graphical editing are available:
Via an Associated Properties Dialog
Dialog page: Pie Chart
This method of editing uses the Pie Chart dialog to modify the properties of a pie chart object.
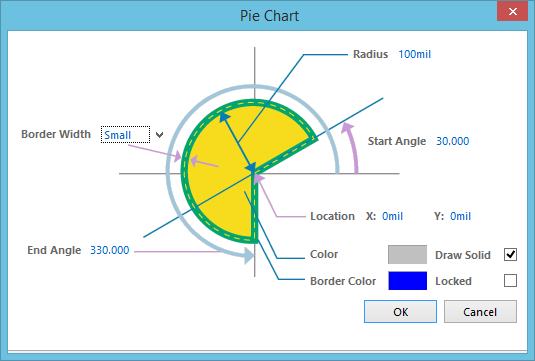
The Pie Chart dialog
The dialog can be accessed during placement by pressing the Tab key.
After placement, the dialog can be accessed in one of the following ways:
- Double-click on the placed pie chart object.
- Place the cursor over the pie chart object, right-click then choose Properties from the context menu.
Via an Inspector Panel
Panel pages: SCH Inspector, SCHLIB Inspector
An Inspector panel enables you to interrogate and edit the properties of one or more design objects in the active document.